
Blackbuck has a large number of microservices which communicate with each other in different ways: synchronous and asynchronous for a single business transaction. In case of performance degradation that is experienced in a request which flows through different services, identification of the bottleneck component that caused performance degradation can become complex task if we use traditional way of tracing (i.e independent tracing in each microservice). To address this challenge, we have implemented distributed tracing at Blackbuck.
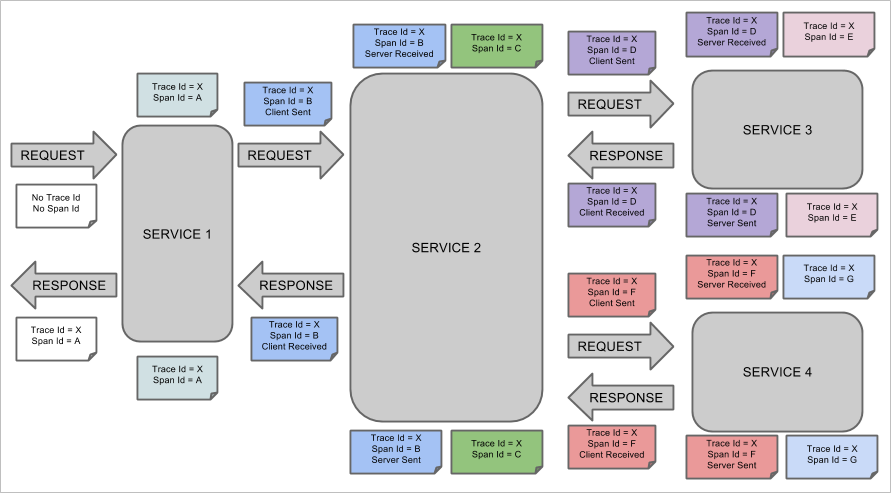
Distributed Tracing is a method for tracking transactions allowing us to follow the progress of a single business transaction from origin to destination. Each request refers to a single event being traced, and the path of the request through a system is called a "trace". Each trace covers multiple spans, one span being a single step in the processing of a request. As a request is traced through each span, we can record contextual data from all participants. we can then use this data to profile or monitor apps, locate bottlenecks, and diagnose performance issues.
Below diagram illustrates the relationship of trace and spans
Blackbuck uses ELK stack for log management. Since the traceId remains same along the flow, it is used in logging so that when we search in ElasticSearch with this traceId, logs from different services can be searched in a single place. Also, traceId is being included in the data collected by the APM (Newrelic) so that app errors analysis or performance analysis done on the APM data can be traced back.
At Blackbuck, we use Brave, a distributed tracing instrumentation library. With Brave, typically trace data is sent to Zipkin server, however third-party plugins are available to send to alternate services such as Amazon X-Ray. We send trace data to Zipkin server.
Zipkin Flow Overview
The component in an instrumented app that sends data to Zipkin is called a Reporter. Reporters send trace data via one of the several transports to Zipkin collectors, which persist trace data to storage. Later, storage is queried by the API to provide data to the UI. Below diagram describes this flow
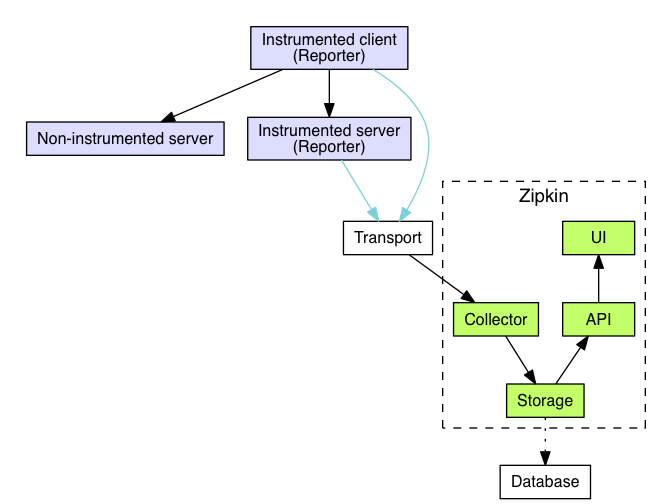
Trace instrumentation reports spans asynchronously to prevent delays or failures relating to the tracing system from delaying or breaking user code.
There are three primary transports for the trace data: HTTP, Kafka and Scribe.Once the trace data arrives at the Zipkin collector daemon, it is validated, stored, and indexed for lookups by the Zipkin collector. The trace data can be persisted to a choice of database such as Cassandra , ElasticSearch or MySQL
At Blackbuck we have chose Kafka transporter for sending span data to Zipkin and ElasticSearch as DB as we use the ES cluster setup for many other internal needs.
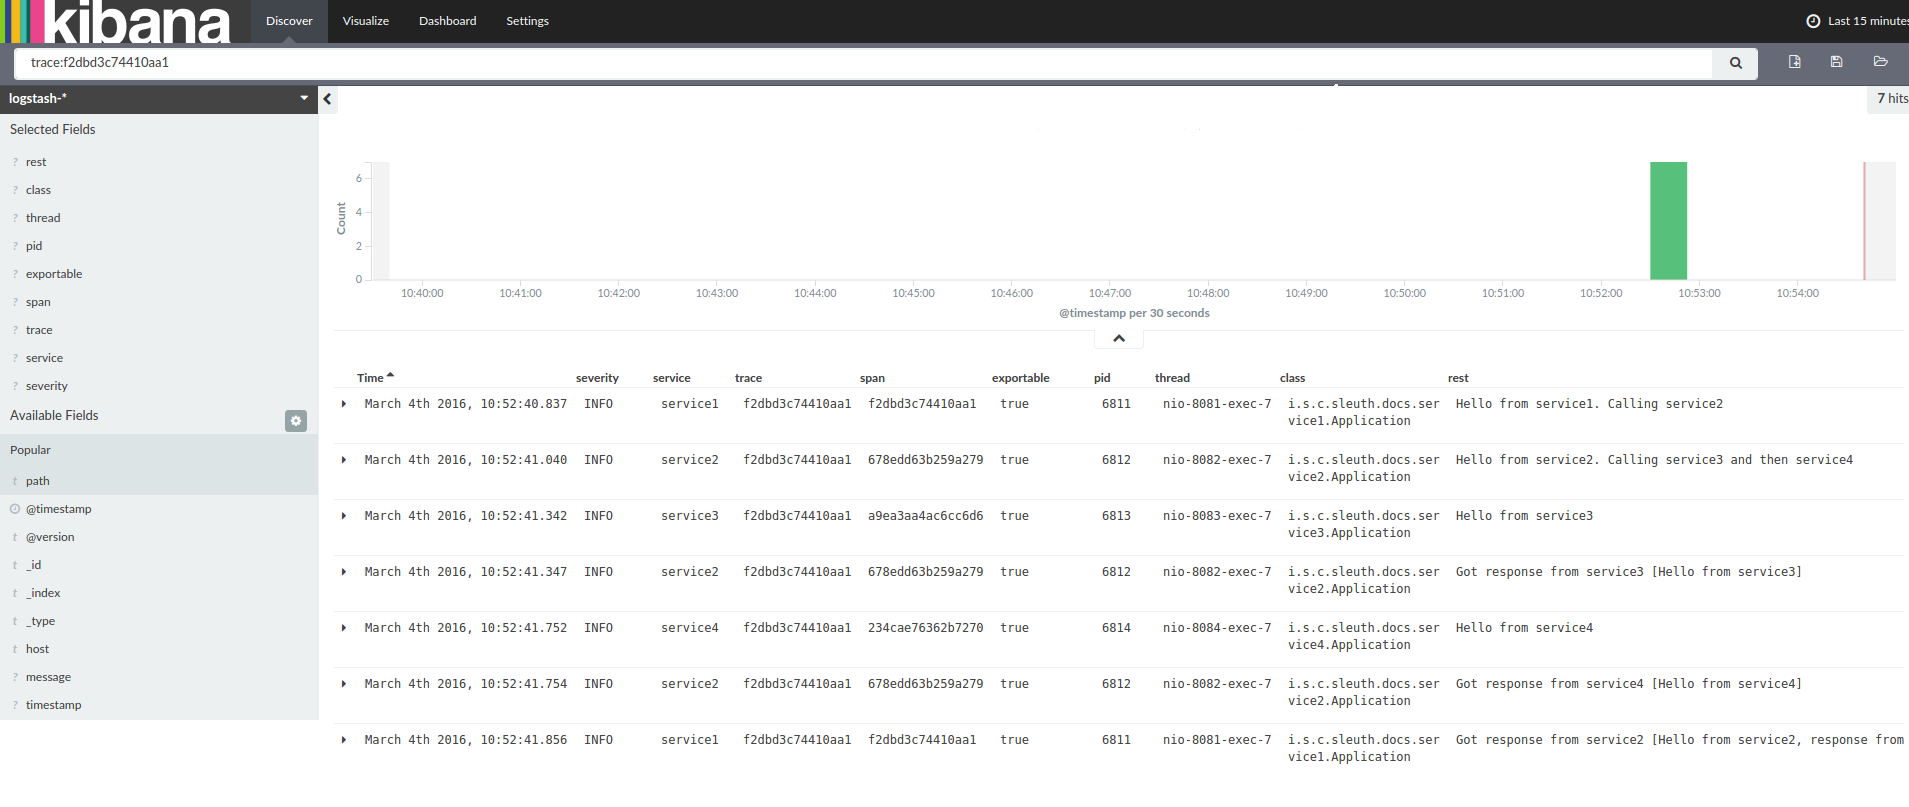
For example, a request has to flow through service1, service2, service3 as traceId is common to these services, the log search process is simplified where we search with traceId and all the logs for that business transaction appear in the same place . Below screenshot illustrates this
Once the data are reported to Zipkin, we can query and view the data on the UI component of Zipkin server. Below is an example data
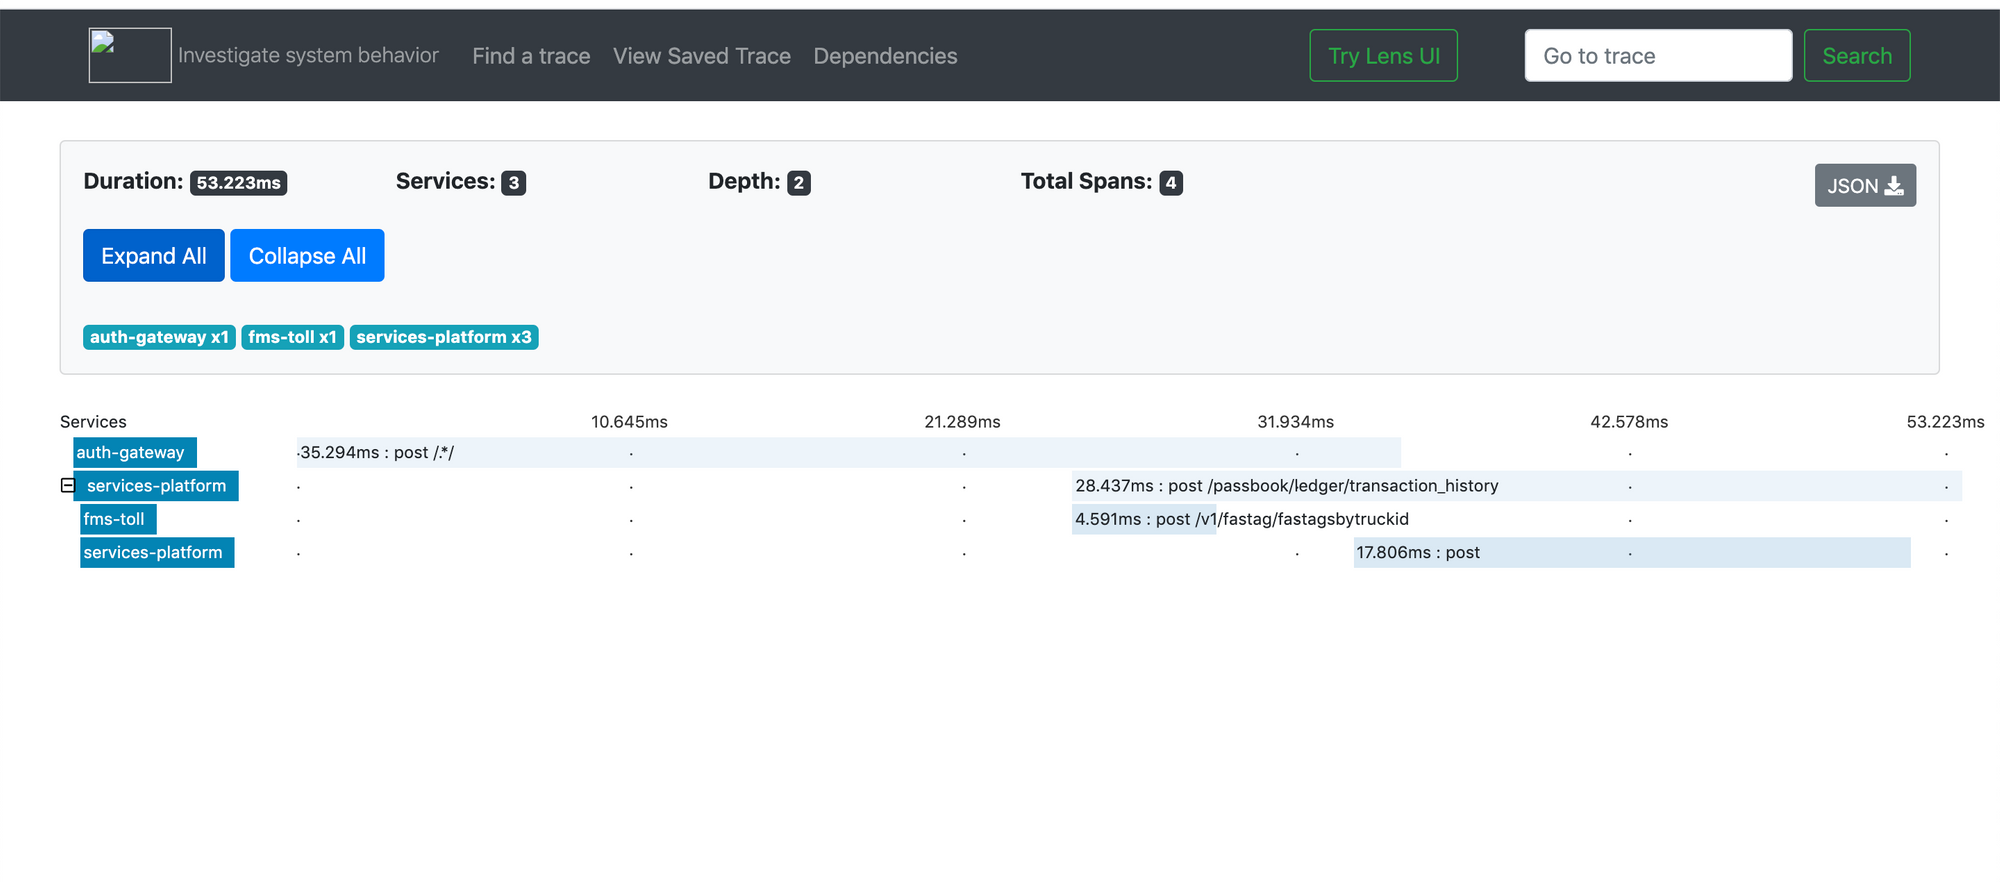
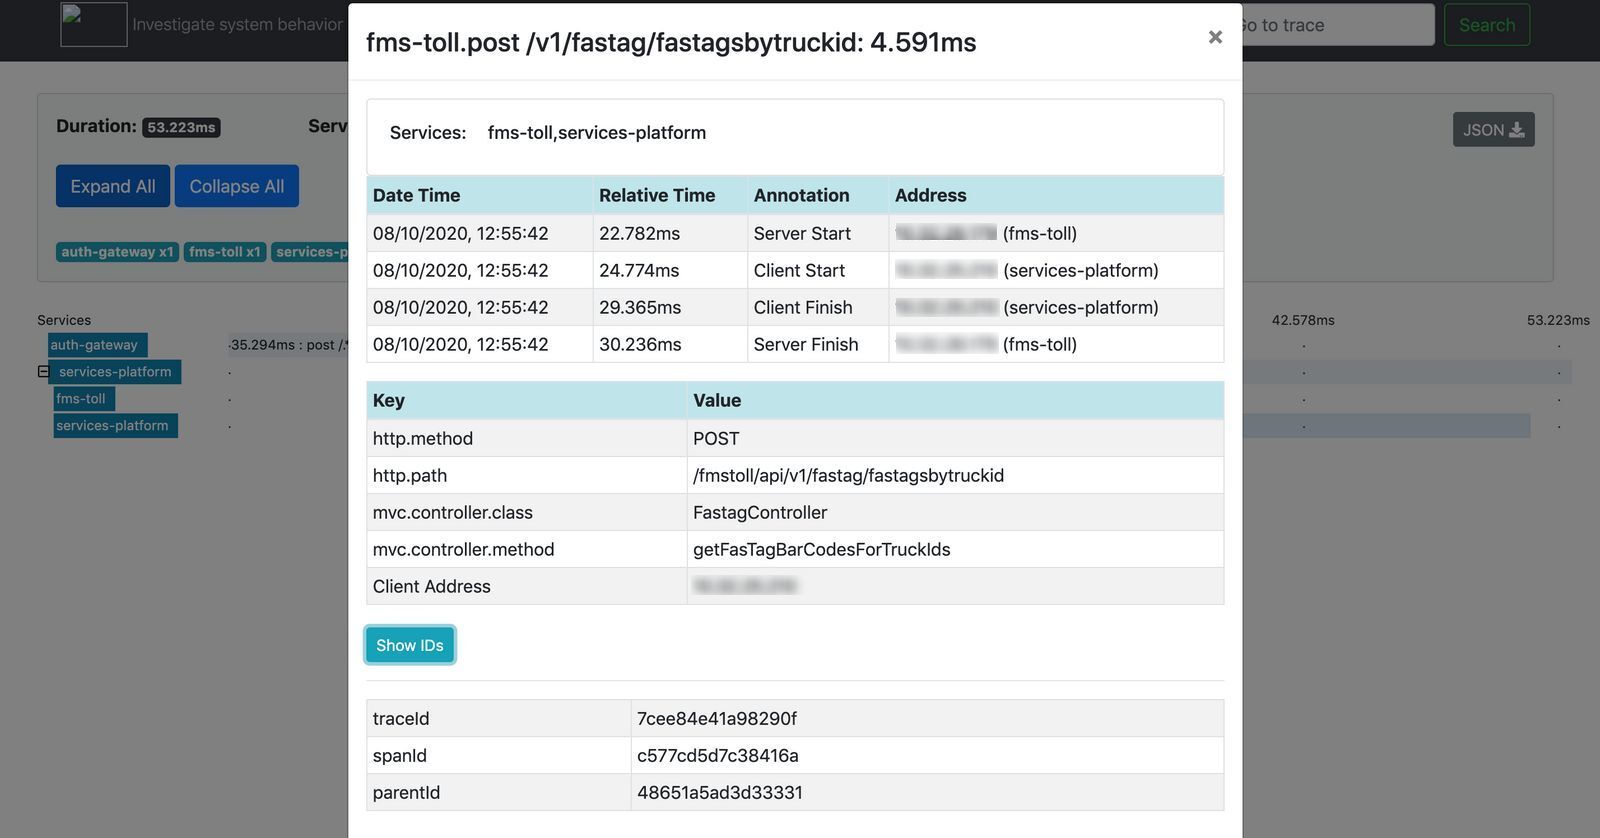
As shown in the UI, We can visualise which call is taking how much time and when there are performance issues, we can simply check here which service is causing it and deep dive into that service to fix the issue. When we click on any of the span, more information like client ip address, exact start and end of the http call execution captured and any other custom data collected is provided for viewing as shown below
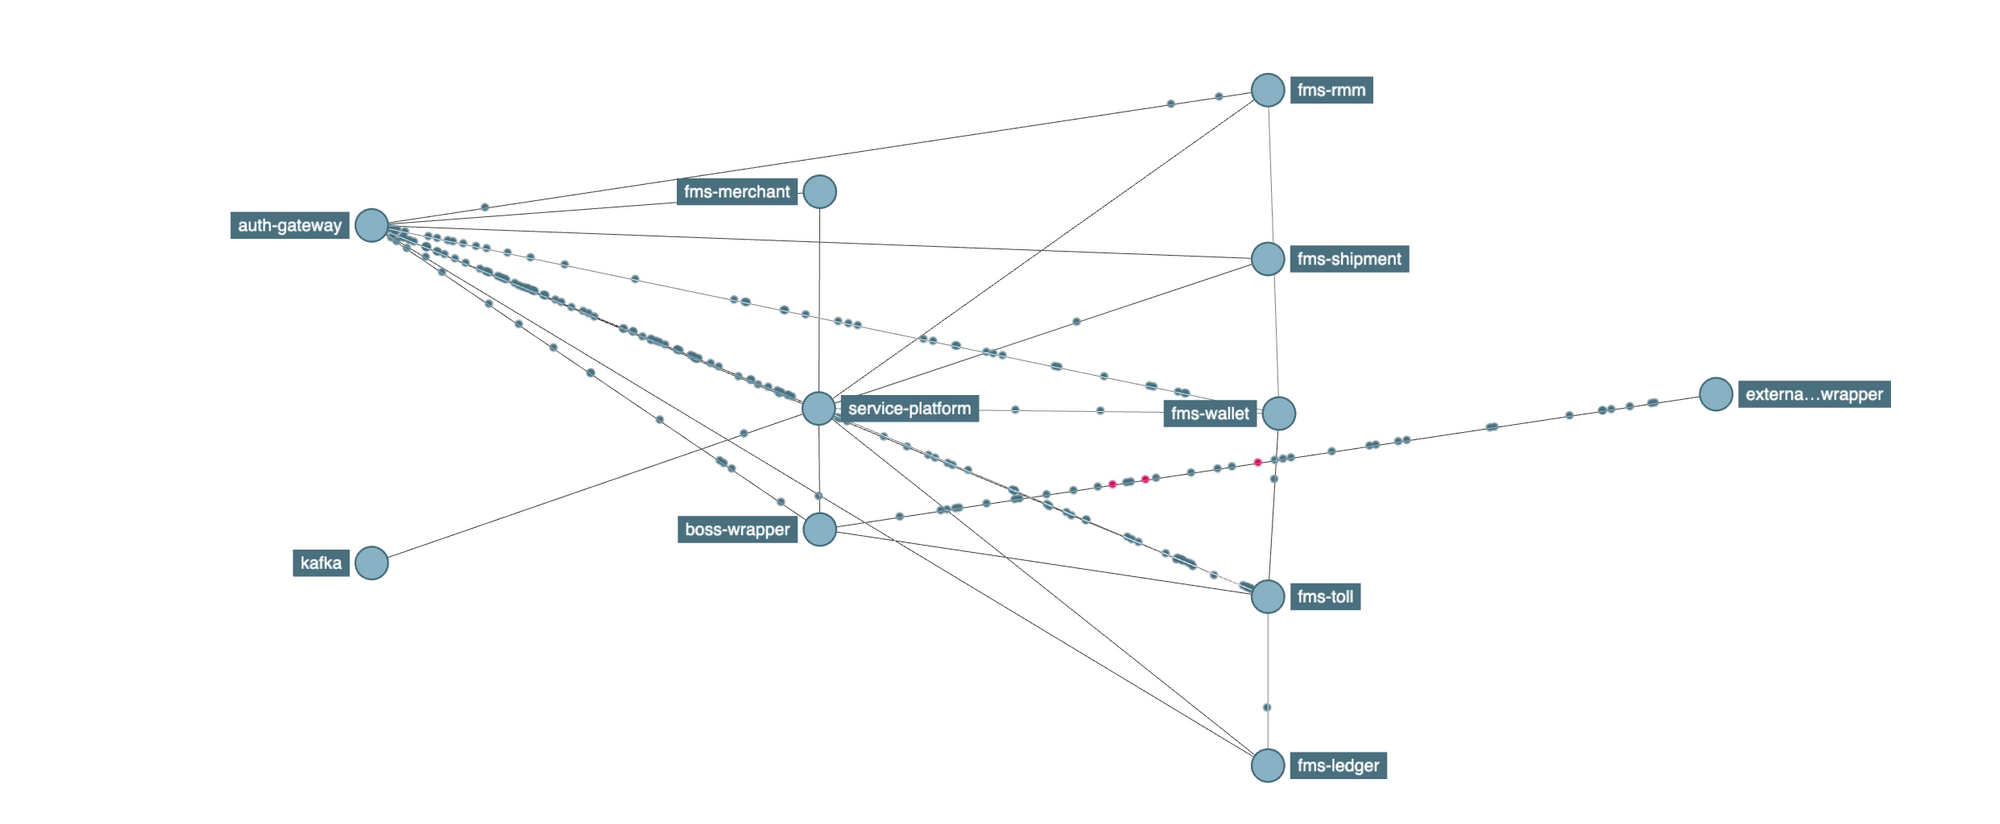
Service Dependency Graphs
Since the data captured for distributed tracing has the interactions between different services, it can be used to analyse the dependencies between different services
Zipkin includes a tool to build service dependency diagrams from traces, including the count of calls and how many errors exist. Below is an example service dependency diagram. At BlackBuck we use this to detect and remove any circular dependency and also to scale our systems.